Verification of the relationship between the volume and the temperature of a gas at constant pressure
Required Apparatus
Narrow uniform glass tube with thin walls closed at one end having a column of dry air trapped by an index of mercury at the closed end, a thermometer, a tall beaker of water, a stirrer, a tripod, a wire gauze, a bunsen burner, a clamp stand, a few rubber bands, and a scale calibrated in mm.
Scientific Theory
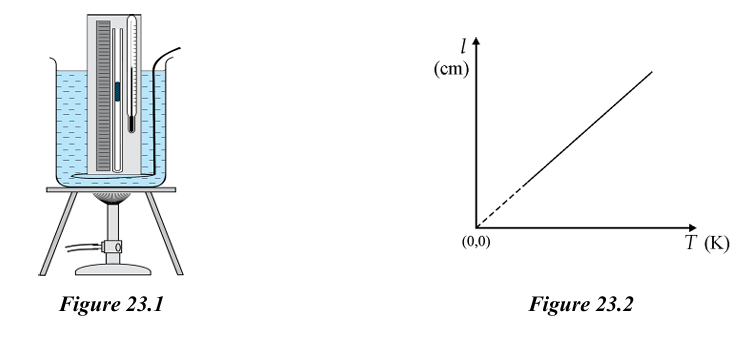
According to the Figure 23.1, if the volume of the air trapped in the tube is and the Kelvin temperature of the gas is , then according to Charles' law,
of a fixed mass of a gas at constant pressure
If the length of the air column is and the area of internal cross-section of the tube is ,
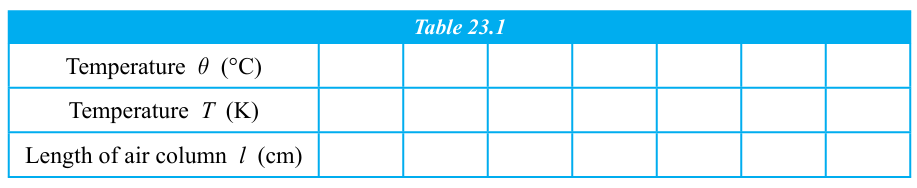
If the graph of plotted against passes through the origin as a straight line, the relationship between the volume of the gas and its temperature is verified.
<image>If is the volume of the air enclosed in the bent portion of the tube and the area of internal cross section of the tube,
Experimental Method
- Attach the tube to the scale so that the closed end of the tube coincides with the zero of the scale and fix the thermometer placing its bulb close to the middle of the air column.
- Set up the apparatus as shown in the Figure 23.1 and note down the reading of the thermometer and the length of the air column.
- Heat the water in the beaker while being stirred. When the temperature has increased by about remove the burner, stir the water and maintaining a constant reading of the thermometer note down the reading of the thermometer and the length of the air column again when the mercury index becomes still.
- Continue the heating of the water in the beaker while being stirred and obtain six pairs of readings in this manner at every rise of temperature.
- Plot against .
Important Points
- Conclude the relationship between the volume and the temperature of a gas at constant pressure as illustrated by the graph.
- Discuss how the courses of action taken to increase the accuracy of the results have influenced the experiment.
- It is more suitable to note down the length of the air column on two occasions, once when the temperature is rising and next when the temperature is falling. This would minimize the error due to the sticking of the mercury index to the wall of the tube.
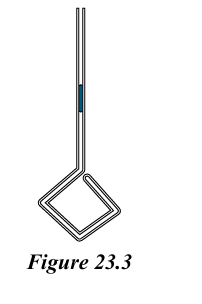
- By bending the tube as shown in Figure 23.3 to increase the length of the air column in the narrow uniform tube or by connecting a small glass bulb to the end of the tube the sensitivity of the apparatus can be increased and this would enable to obtain a good spread between the readings.