#22Q2) Heat
Determination of the atmospheric pressure using the quill tube
Required Apparatus
A Quill tube (a thin glass tube having a column of dry air trapped inside by a thread of mercury), a metre ruler, and a clamp stand.
Scientific Theory
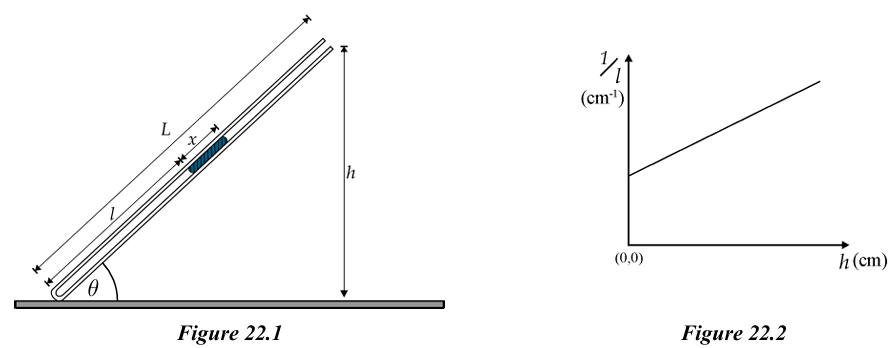
- : vertical height from the table to the top end of the tube
- : length of air column
- : length of the tube
- : Internal area of cross-section of the tube
- : length of the mercury thread
- : density of mercury
- : atmospheric pressure (cm Hg)
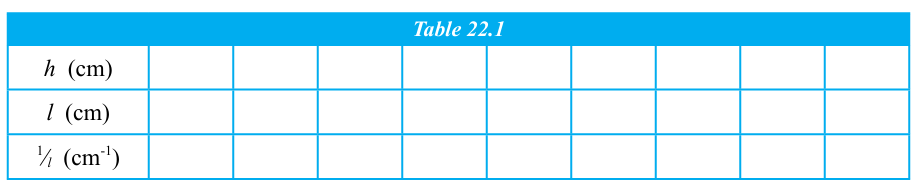
According to Boyle's law:
Gradient of the graph of against :
Experimental Method
- Attach the tube to the stand as shown in the Figure 22.1 with its closed end on the table and inclined to the horizontal.
- Measure the height from the table to the top end of the tube and the length of the air column and note down these values.
- Change the inclination of the tube by adjusting the stand and obtain six pairs of values of and .
- Also measure and note down the length of the mercury thread and the length of the tube.
- Plot against , calculate the gradient of the graph, obtain the intercept and calculate the atmospheric pressure as explained in the theory.
Important Points
1
- Conclude the value of as obtained from the results of the experiment.
2
- Obtain the atmospheric pressure from a standard barometer and calculate the percentage error of your experimental value.
3
- To prepare the Quill tube take a narrow glass tube of about one metre in length, internal diameter about 2 mm and open at both ends. Insert into it a mercury thread about 10 cm long. Place the tube horizontally and arrange the thread of mercury to reach the middle of the tube. Now hold one end of the tube to a bunsen flame and seal the end while rotating the tube.
4
- Place the tube on the metre ruler so that the closed end of the tube coincide with the zero mark of the ruler and attach the tube to the ruler using rubber bands.
5
- Readings can be obtained for negative values of too by keeping the tube inverted with open end pointing downwards.
6
- If a straight line graph is obtained as expected from the results of the experiment, the relationship used (Boyle's law) to derive the equation gets verified too.