Location of the images formed by a convex lens by the method of no-parallax and hence determination of the focal length of the lens
Required Apparatus
A convex lens mounted on a stand, two optical pins fixed with stands, a metre ruler, and a background screen.
Scientific Theory
For a convex lens if is the object distance, is the image distance and the focal length,
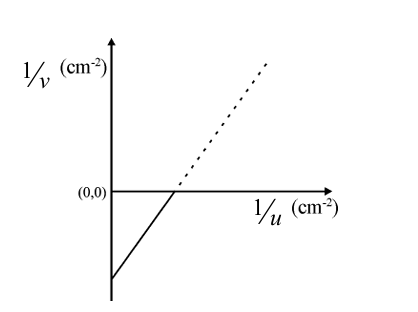
If the graph is plotted using the new cartesian convention, the intercept of the graph of against will be . The focal length of the lens can be calculated accordingly.
(For real images the value of is and the value of is and hence is and is )
If the readings of the experiment are plotted using the sign convention, the graph obtained will be as follows.
Alternative methods of calculating focal length:
For real objects and real images,
(i) when the sign convention is applied to all , and ,
When is plotted against , the intercept of the graph .
(ii) when the sign convention is applied to all , and ,
Multiplying by
When is plotted against , the gradient gives the value of . From the readings it can be verified that for real objects and real images .
Experimental Method
- Point the given convex lens to a distant object and obtain its clear image on a screen. Measure the distance between the lens and the screen using the ruler and find the approximate focal length of the lens.
- Draw a straight line in chalk on the table. Mid way on this line, place the lens mounted on the stand normal to the line.
- On one side of the lens at a distance little further than the approximate focal length that was found, place the optical pin (O) fixed on the stand on the line drawn so that the tip of the optical pin is on the optical axis of the lens.
- Place the background screen on the same side as this object pin but further away from the lens.
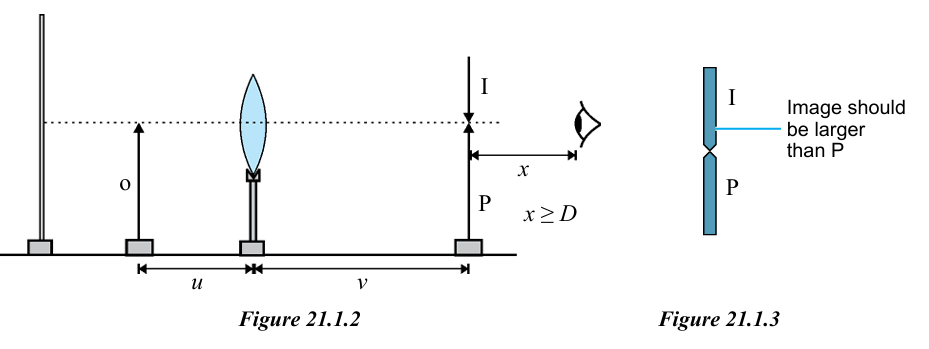
- Place the eye on the opposite side of the lens and observe where an inverted clear image (I) is visible. If not push the object pin further from the lens until the inverted image is visible. (According to Figure 21.1.2, least distance of distinct vision). <image>
-
Now place the other optical pin (P) as shown in Figure 21.1.2 along the axis and adjust its tip to be on the principal axis.
-
Adjust P either forwards or backwards until the tip of P coincides with the tip of the image I. In this situation of coincidence (or no-parallax), when the eye of the observer is moved sideways on the axis the tips of I and P should appear to move together without any relative motion.
-
Now measure the distance between the lens and the object and the distance between the lens and the image using the metre ruler.
-
By altering the object distance suitably obtain five more pairs of readings for and and record these readings (with the appropriate sign according to the new cartesian convention).
-
Plot against . Calculate the focal length of the lens from the intercept of the graph as explained in the theory.
Important Points
- Conclude the value obtained from the above calculation as the focal length of the lens.
- Discuss any courses of action you could take to minimise the errors and determine the focal length of the lens accurately.
- If the object is placed close to the focal point of the lens the image would be too far from the lens and may not be visible to the eye. (For the image to be visible clearly it should be situated at the least distance of distinct vision from the eye). Hence take care to adjust the object distance suitably.
- The graph is plotted not with values of but with values of . Hence to obtain a good spread of values select values of so that the gaps between successive values of remain equal. Eg. Values of : , , , , , .
- Since the real images of a convex lens can be interchanged with respective objects (conjugate points) any pair of values of and can be interchanged and taken as another pair of values.
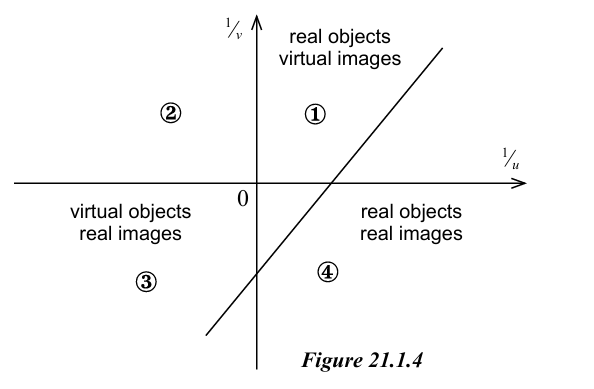
- This experiment details only with real objects and real images. But if required, the experiment can be performed as real objects - virtual images or virtual objects - real images (according to new cartesian sign convention for real objects - virtual images it will be and while for virtual object - real images it and .
The graph can be drawn for all these situations and it will occupy quadrants 1, 3 and 4. It will be one straight line for all three situations and the focal length can be found from the intercept of any graph.